Usage of sudo command alias and it various useful features with examples given.
Syntax
Cmnd_Alias NAME = cmnd1, cmnd2, cmnd3 ….
To define command alias in sudoers file must remember two hard coded rules
Alias name should be defined in uppercase letters and can contain number, alphabet and underscore (_). Alias name must start with alphabet.
NAME = [A-Z]([A-Z][0-9]_)
Commands must be specified in absolute path format.
Command alias can be mapped to either user or group.
Example1
User “romeo” should be able to create new user and password.
ROMEO_CMDS = /usr/sbin/useradd, /usr/bin/passwd
romeo ALL = (ALL) ROMEO_CMDS
Here mentioning relative path or just direct command (passwd, useradd) will make sudo non-functional.
The same can be defined using user id by adding hash (#) as prefix.
#502 ALL = (ALL) ROMEO_CMDS
Example2
Grant same privileges to group “tree”
%tree ALL = (ALL) ROMEO_CMDS
Advanced option
Grant access to execute all the commands in a directory. Directory name must be full path and should end with slash (/). The trailing slash used by system to identify either it is a command or directory.
Cmnd_Alias APP_CMDS = /opt/was/bin/
Multiple different command aliases can be defined at once using colon (:)
Placing commands inside double quote (“) says strictly stick with command and do not accept any argument.
mala ALL = (ALL) /sbin/, ! /sbin/init
Here user mala allowed running any command inside /sbin directory but not “init”.
fry ALL = (root) /bin/su [!-]*[!root]*
Using exclamation symbol can restrict at argument level. Above allows user fry to run /bin/su command with root privileges. Same time it restricts using any options/argument and login to root.
One command alias can be referred into another command alias.
Cmnd_Alias SUN = /usr/bin/passwd
Cmnd_Alias SWE = /usr/sbin/useradd, SUN
To say sudo to should not accept any argument but only just execute command, append double quote at end. (“”) swe ALL = (ALL) /sbin/hwclock “” User swe can see hardware clock time but will not be able to modify any settings.
All Unix and Unix-like systems generate a metric of three "load average" numbers in the kernel. Users can easily query the current result from a Unix shell by running the uptime command:
The above load average of 1.73 0.50 7.98 on a single-CPU system as:
during the last minute, the CPU was overloaded by 73% (1 CPU with 1.73 runnable processes, so that 0.73 processes had to wait for a turn)
during the last 5 minutes, the CPU was underloaded 50% (no processes had to wait for a turn)
during the last 15 minutes, the CPU was overloaded 698% (1 CPU with 7.98 runnable processes, so that 6.98 processes had to wait for a turn)
Nagios threshold value calculation:
For Nagios CPU Load setup, which includes warning and critical:
y = c * p / 100
Where: y = nagios valuec = number of coresp = wanted load procent
for a 4 core system:
time      5 min  10 min    15 min
warning:  90%    70%       50%
critical: 100%   80%       60%

command[check_load]=/usr/local/nagios/libexec/check_load -w 3.6,2.8,2.0 -c 4.0,3.2,2.4
For a single core system:
y = p / 100
Where: y = nagios valuep = wanted load procent
time       5 min  10 min    15 min
warning:   70%    60%       50%
critical:  90%    80%       70%

command[check_load]=/usr/local/nagios/libexec/check_load -w 0.7,0.6,0.5 -c 0.9,0.8,0.7
A great white paper about CPU Load analysis by Dr. Gunther http://www.teamquest.com/pdfs/whitepaper/ldavg1.pdf In this online article Dr. Gunther digs down into the UNIX kernel to find out how load averages (the “LA Triplets”) are calculated and how appropriate they are as capacity planning metrics.
Getting the best end-user performance from HTTP/2 requires good support for resource prioritization. While most web servers support HTTP/2 prioritization, getting it to work well all the way to the browser requires a fair bit of coordination across the networking stack. This article will expose some of the interactions between the web server, Operating System and network and how to tune a server to optimize performance for end users.
tl;dr
On Linux 4.9 kernels and later, enable BBR congestion control and set tcp_notsent_lowat to 16KB for HTTP/2 prioritization to work reliably. This can be done in /etc/sysctl.conf:
A single web page is made up of dozens to hundreds of separate pieces of content that a web browser pulls together to create and present to the user. The main content (HTML) for the page you are visiting is a list of instructions on how to construct the page and the browser goes through the instructions from beginning to end to figure out everything it needs to load and how to put it all together. Each piece of content requires a separate HTTP request from the browser to the server responsible for that content (or if it has been loaded before, it can be loaded from a local cache in the browser).
In a simple implementation, the web browser could wait until everything is loaded and constructed and then show the result but that would be pretty slow. Not all of the content is critical to the user and can include things such as images way down in the page, analytics for tracking usage, ads, like buttons, etc. All the browsers work more incrementally where they display the content as it becomes available. This results in a much faster user experience. The visible part of the page can be displayed while the rest of the content is being loaded in the background. Deciding on the best order to request the content in is where browser request prioritization comes into play. Done correctly the visible content can display significantly faster than a naive implementation.
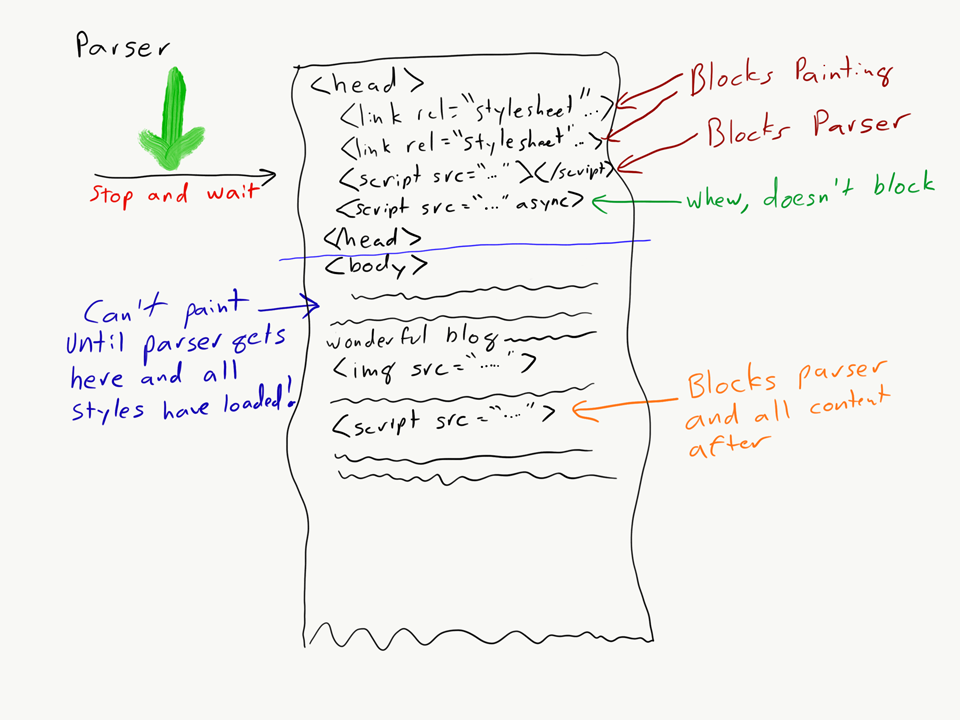
HTML Parser blocking page render for styles and scripts in the head of the document.
Most modern browsers use similar prioritization schemes which generally look like:
Load similar resources (scripts, images, styles) in the order they were listed in the HTML.
Load styles/CSS before anything else because content cannot be displayed until styles are complete.
Load blocking scripts/JavaScript next because blocking scripts stop the browser from moving on to the next instruction in the HTML until they have been loaded and executed.
Load images and non-blocking scripts (async/defer).
Fonts are a bit of a special case in that they are needed to draw the text on the screen but the browser won’t know that it needs to load a font until it is actually ready to draw the text to the screen. So they are discovered pretty late. As a result they are generally given a very high priority once they are discovered but aren’t known about until fairly late in the loading process.
Chrome also applies some special treatment to images that are visible in the current browser viewport (part of the page visible on the screen). Once the styles have been applied and the page has been laid out it will give visible images a much higher priority and load them in order from largest to smallest.
HTTP/1.x prioritization
With HTTP/1.x, each connection to a server can support one request at a time (practically anyway as no browser supports pipelining) and most browsers will open up to 6 connections at a time to each server. The browser maintains a prioritized list of the content it needs and makes the requests to each server as a connection becomes available. When a high-priority piece of content is discovered it is moved to the front of a list and when the next connection becomes available it is requested.
HTTP/2 prioritization
With HTTP/2, the browser uses a single connection and the requests are multiplexed over the connection as separate “streams”. The requests are all sent to the server as soon as they are discovered along with some prioritization information to let the server know the preferred ordering of the responses. It is then up to the server to do its best to deliver the most important responses first, followed by lower priority responses. When a high priority request comes in to the server, it should immediately jump ahead of the lower priority responses, even mid-response. The actual priority scheme implemented by HTTP/2 allows for parallel downloads with weighting between them and more complicated schemes. For now it is easiest to just think about it as a priority ordering of the resources.
Most servers that support prioritization will send data for the highest priority responses for which it has data available. But if the most important response takes longer to generate than lower priority responses, the server may end up starting to send data for a lower priority response and then interrupt its stream when the higher priority response becomes available. That way it can avoid wasting available bandwidth and head-of-line blocking where a slow response holds everything else up.
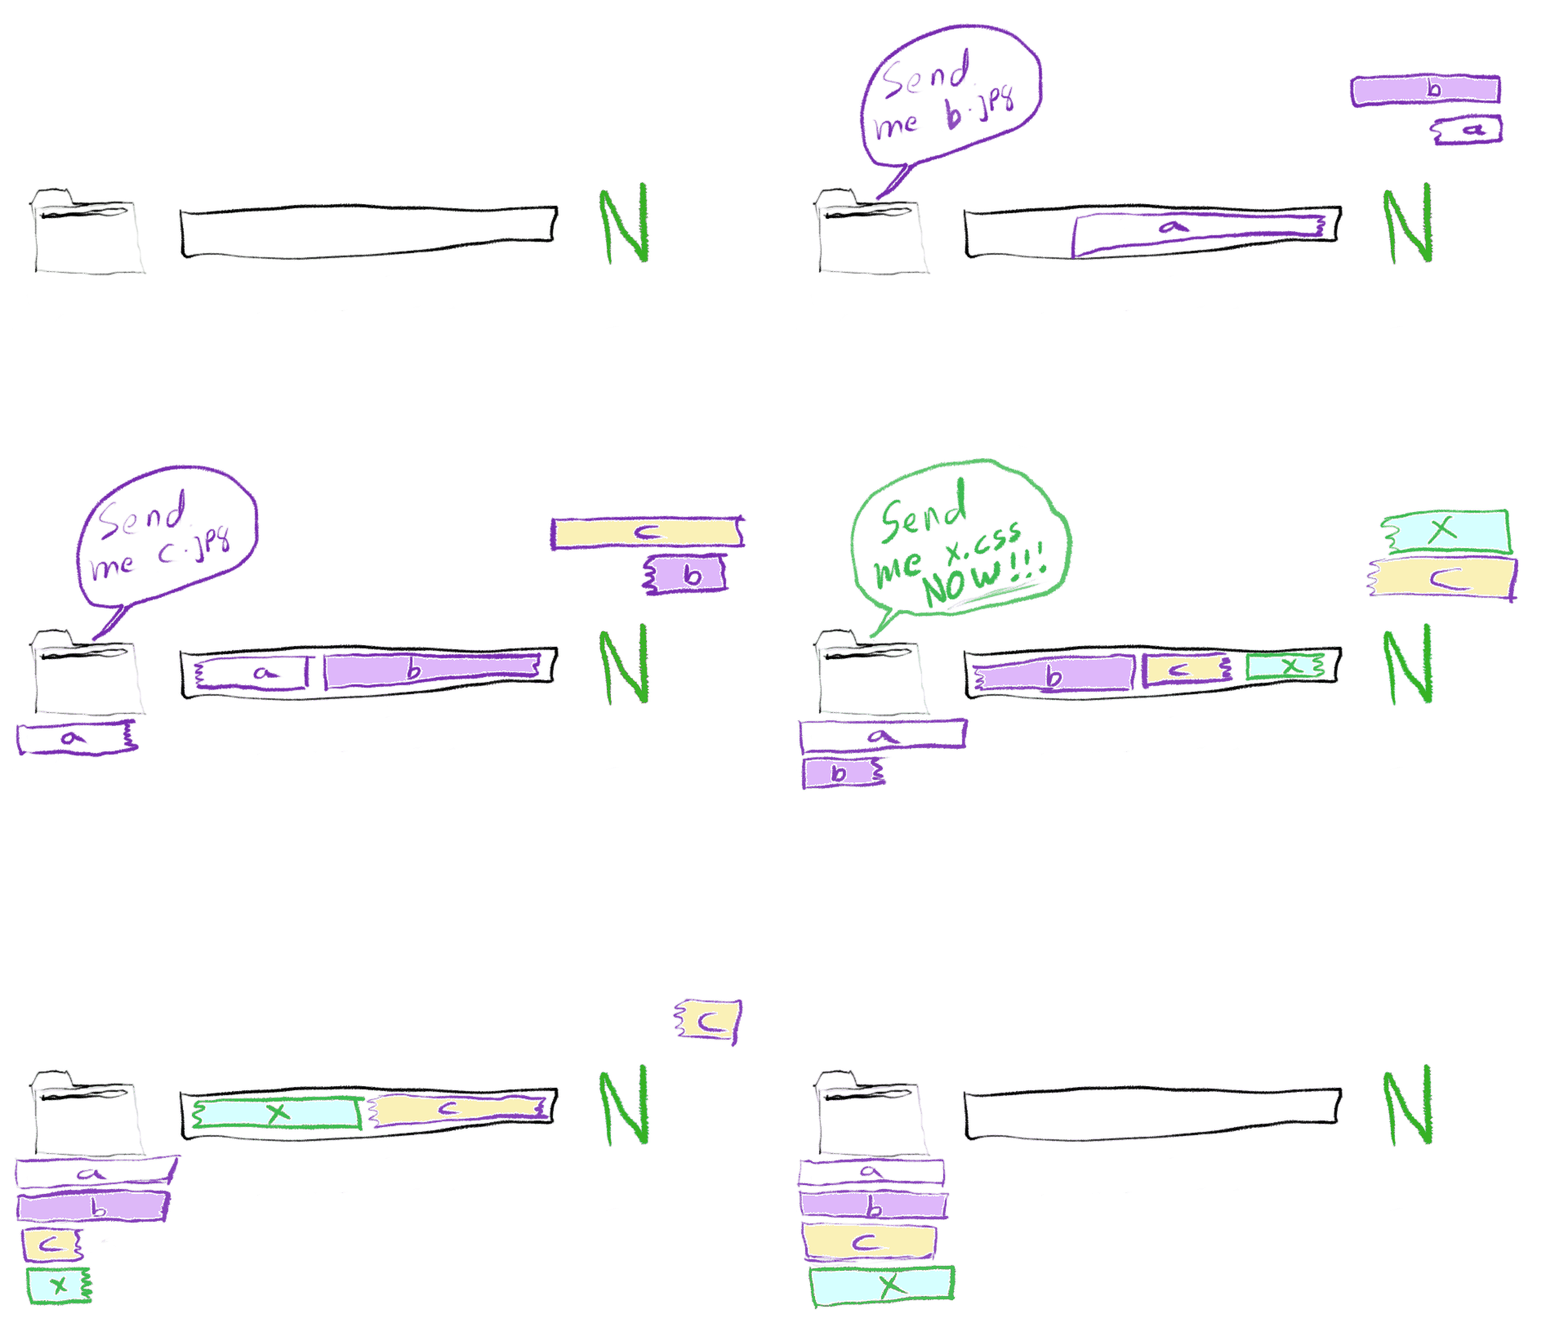
Browser requesting a high-priority resource after several low-priority resources.
In an optimal configuration, the time to retrieve a top-priority resource on a busy connection with lots of other streams will be identical to the time to retrieve it on an empty connection. Effectively that means that the server needs to be able to interrupt the response streams of all of the other responses immediately with no additional buffering to delay the high-priority response (beyond the minimal amount of data in-flight on the network to keep the connection fully utilized).
Buffers on the Internet
Excessive buffering is pretty much the nemesis for HTTP/2 because it directly impacts the ability for a server to be nimble in responding to priority shifts. It is not unusual for there to be megabytes-worth of buffering between the server and the browser which is larger than most websites. Practically that means that the responses will get delivered in whatever order they become available on the server. It is not unusual to have a critical resource (like a font or a render-blocking script in the <head> of a document) delayed by megabytes of lower priority images. For the end-user this translates to seconds or even minutes of delay rendering the page.
TCP send buffers
The first layer of buffering between the server and the browser is in the server itself. The operating system maintains a TCP send buffer that the server writes data into. Once the data is in the buffer then the operating system takes care of delivering the data as-needed (pulling from the buffer as data is sent and signaling to the server when the buffer needs more data). A large buffer also reduces CPU load because it reduces the amount of writing that the server has to do to the connection.
The actual size of the send buffer needs to be big enough to keep a copy of all of the data that has been sent to the browser but has yet to be acknowledged in case a packet gets dropped and some data needs to be retransmitted. Too small of a buffer will prevent the server from being able to max-out the connection bandwidth to the client (and is a common cause of slow downloads over long distances). In the case of HTTP/1.x (and a lot of other protocols), the data is delivered in bulk in a known-order and tuning the buffers to be as big as possible has no downside other than the increase in memory use (trading off memory for CPU). Increasing the TCP send buffer sizes is an effective way to increase the throughput of a web server.
For HTTP/2, the problem with large send buffers is that it limits the nimbleness of the server to adjust the data it is sending on a connection as high priority responses become available. Once the response data has been written into the TCP send buffer it is beyond the server’s control and has been committed to be delivered in the order it is written.
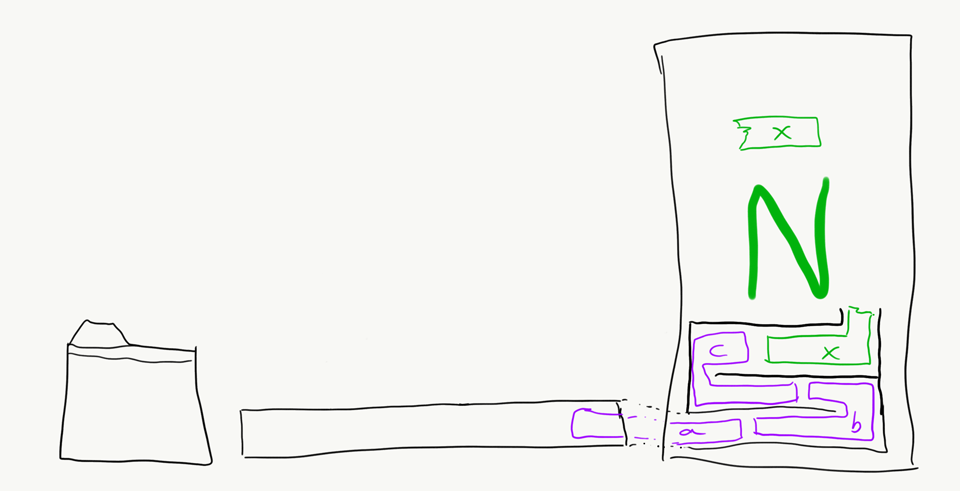
High-priority resource queued behind low-priority resources in the TCP send buffer.
The optimal send buffer size for HTTP/2 is the minimal amount of data required to fully utilize the available bandwidth to the browser (which is different for every connection and changes over time even for a single connection). Practically you’d want the buffer to be slightly bigger to allow for some time between when the server is signaled that more data is needed and when the server writes the additional data.
TCP_NOTSENT_LOWAT
TCP_NOTSENT_LOWAT is a socket option that allows configuration of the send buffer so that it is always the optimal size plus a fixed additional buffer. You provide a buffer size (X) which is the additional amount of size you’d like in addition to the minimal needed to fully utilize the connection and it dynamically adjusts the TCP send buffer to always be X bytes larger than the current connection congestion window. The congestion window is the TCP stack’s estimate of the amount of data that needs to be in-flight on the network to fully utilize the connection.
TCP_NOTSENT_LOWAT can be configured in code on a socket-by-socket basis if the web server software supports it or system-wide using the net.ipv4.tcp_notsent_lowat sysctl:
net.ipv4.tcp_notsent_lowat = 16384
We have a patch we are preparing to upstream for NGINX to make it configurable but it isn’t quite ready yet so configuring it system-wide is required. Experimentally, the value 16,384 (16K) has proven to be a good balance where the connections are kept fully-utilized with negligible additional CPU overhead. That will mean that at most 16KB of lower priority data will be buffered before a higher priority response can interrupt it and be delivered. As always, your mileage may vary and it is worth experimenting with.
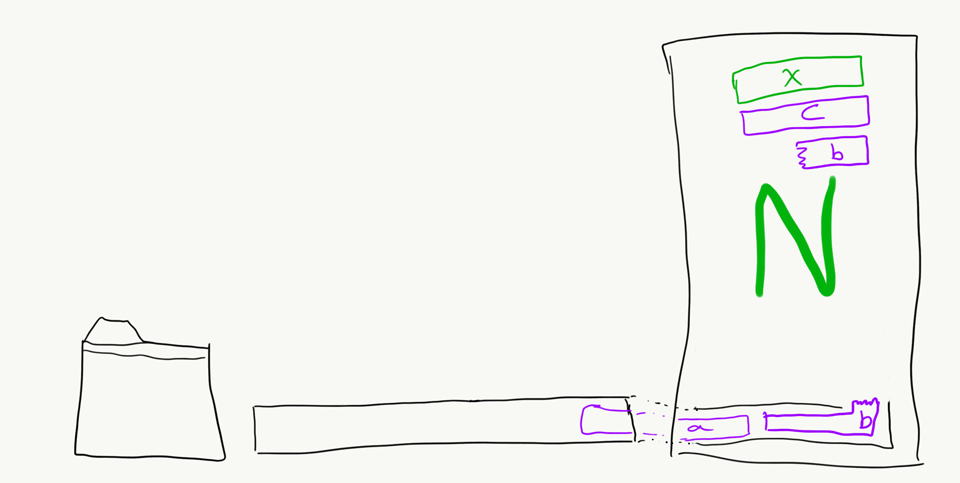
High-priority resource ready to send with minimal TCP buffering.
Bufferbloat
Beyond buffering on the server, the network connection between the server and the browser can act as a buffer. It is increasingly common for networking gear to have large buffers that absorb data that is sent faster than the receiving side can consume it. This is generally referred to as Bufferbloat. I hedged my explanation of the effectiveness of tcp_notsent_lowat a little bit in that it is based on the current congestion window which is an estimate of the optimal amount of in-flight data needed but not necessarily the actual optimal amount of in-flight data.
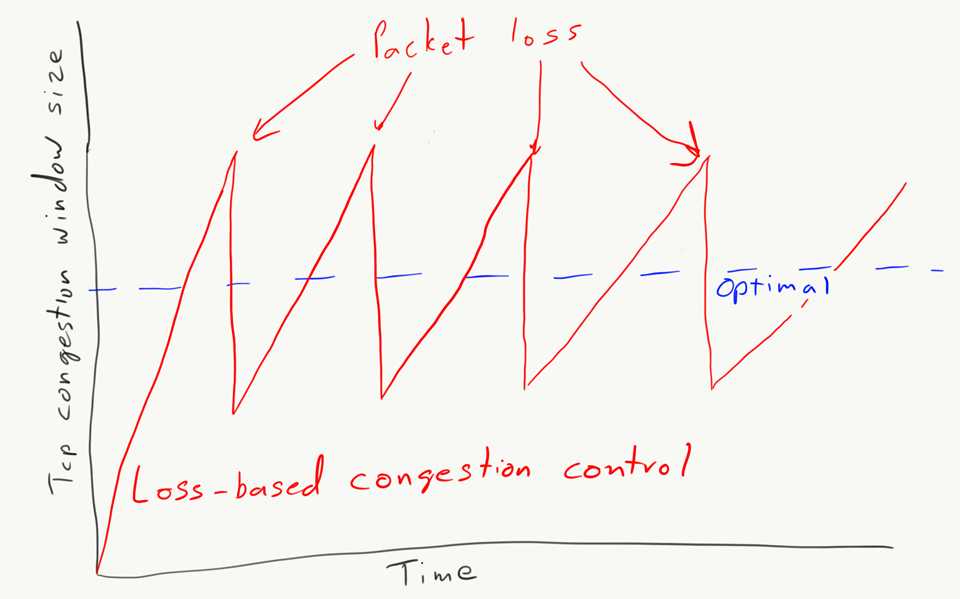
The buffers in the network can be quite large at times (megabytes) and they interact very poorly with the congestion control algorithms usually used by TCP. Most classic congestion-control algorithms determine the congestion window by watching for packet loss. Once a packet is dropped then it knows there was too much data on the network and it scales back from there. With Bufferbloat that limit is raised artificially high because the buffers are absorbing the extra packets beyond what is needed to saturate the connection. As a result, the TCP stack ends up calculating a congestion window that spikes to much larger than the actual size needed, then drops to significantly smaller once the buffers are saturated and a packet is dropped and the cycle repeats.
Loss-based congestion control congestion window graph.
TCP_NOTSENT_LOWAT uses the calculated congestion window as a baseline for the size of the send buffer it needs to use so when the underlying calculation is wrong, the server ends up with send buffers much larger (or smaller) than it actually needs.
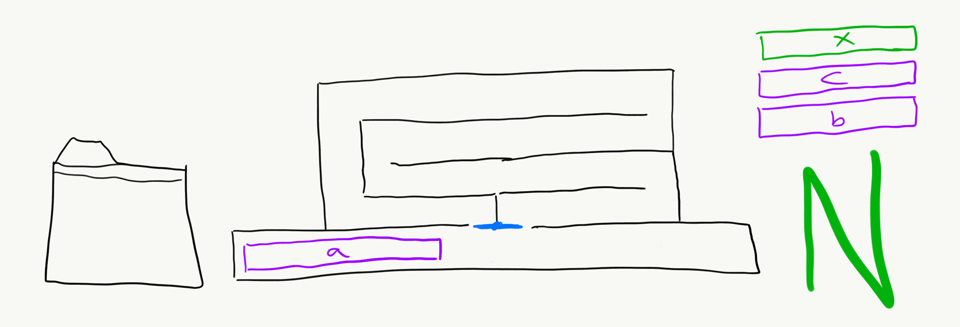
I like to think about Bufferbloat as being like a line for a ride at an amusement park. Specifically, one of those lines where it’s a straight shot to the ride when there are very few people in line but once the lines start to build they can divert you through a maze of zig-zags. Approaching the ride it looks like a short distance from the entrance to the ride but things can go horribly wrong.
Bufferbloat is very similar. When the data is coming into the network slower than the links can support, everything is nice and fast:
Response traveling through the network with no buffering.
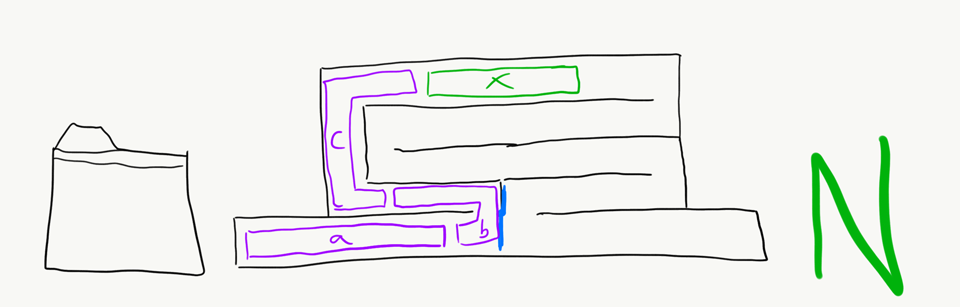
Once the data comes in faster than it can go out the gates are flipped and the data gets routed through the maze of buffers to hold it until it can be sent. From the entrance to the line it still looks like everything is going fine since the network is absorbing the extra data but it also means there is a long queue of the low-priority data already absorbed when you want to send the high-priority data and it has no choice but to follow at the back of the line:
Responses queued in network buffers.
BBR congestion control
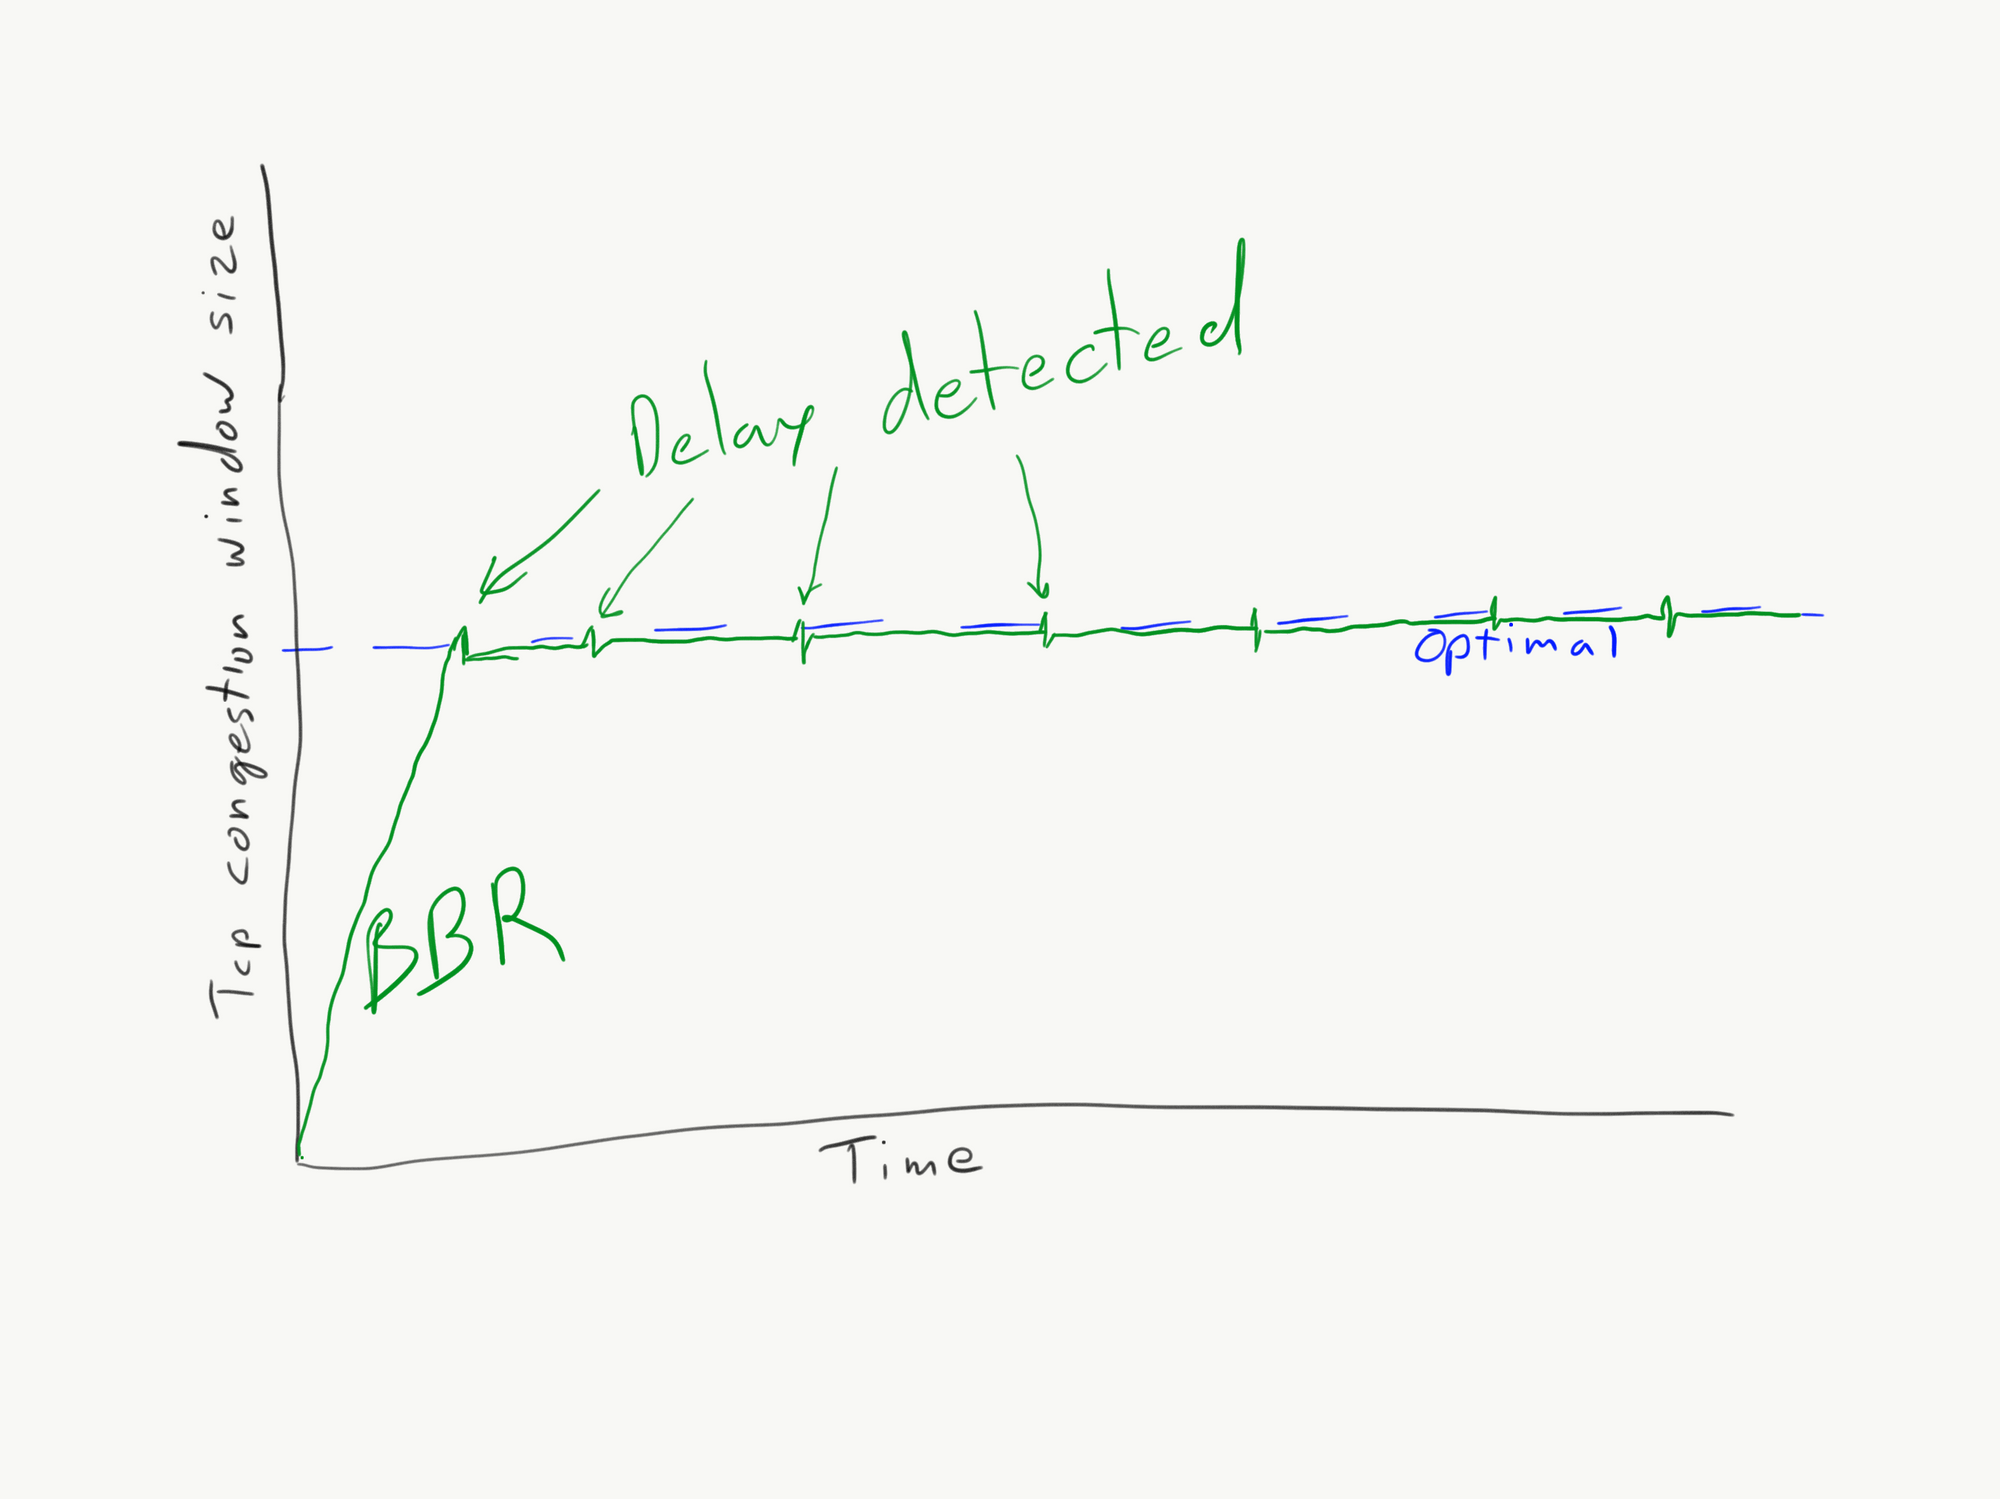
BBR is a new congestion control algorithm from Google that uses changes in packet delays to model the congestion instead of waiting for packets to drop. Once it sees that packets are taking longer to be acknowledged it assumes it has saturated the connection and packets have started to buffer. As a result the congestion window is often very close to the optimal needed to keep the connection fully utilized while also avoiding Bufferbloat. BBR was merged into the Linux kernel in version 4.9 and can be configured through sysctl:
BBR also tends to perform better overall since it doesn’t require packet loss as part of probing for the correct congestion window and also tends to react better to random packet loss.
BBR congestion window graph.
Back to the amusement park line, BBR is like having each person carry one of the RFID cards they use to measure the wait time. Once the wait time looks like it is getting slower the people at the entrance slow down the rate that they let people enter the line.
BBR detecting network congestion early.
This way BBR essentially keeps the line moving as fast as possible and prevents the maze of lines from being used. When a guest with a fast pass arrives (the high-priority request) they can jump into the fast-moving line and hop right onto the ride.
BBR delivering responses without network buffering.
Technically, any congestion control that keeps Bufferbloat in check and maintains an accurate congestion window will work for keeping the TCP send buffers in check, BBR just happens to be one of them (with lots of good properties).
Putting it all together
The combination of TCP_NOTSENT_LOWAT and BBR reduces the amount of buffering on the network to the absolute minimum and is CRITICAL for good end-user performance with HTTP/2. This is particularly true for NGINX and other HTTP/2 servers that don’t implement their own buffer throttling.
The end-user impact of correct prioritization is huge and may not show up in most of the metrics you are used to watching (particularly any server-side metrics like requests-per-second, request response time, etc).
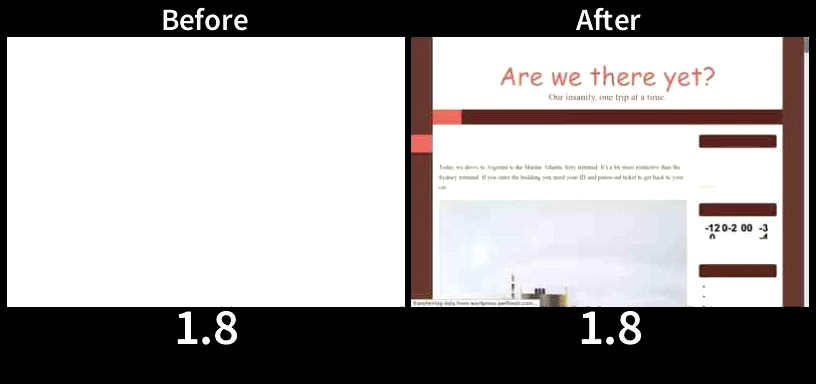
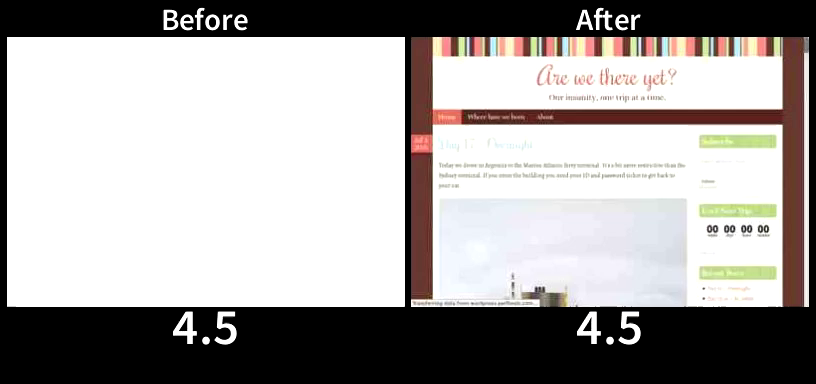
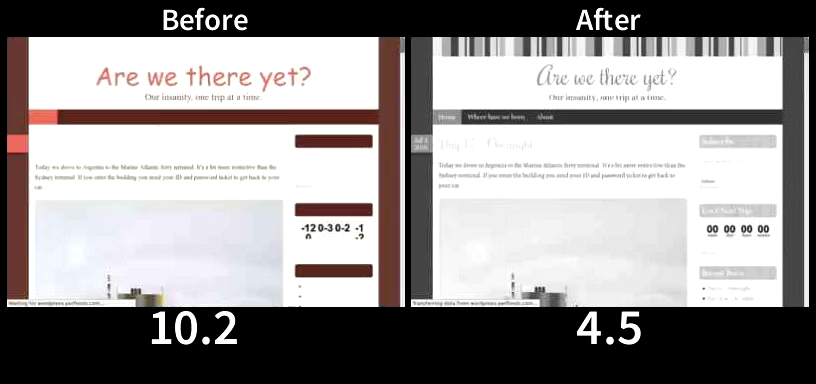
Even on a 5Mbps cable connection proper resource ordering can result in rendering a page significantly faster (and the difference can explode to dozens of seconds or even minutes on a slower connection). Here is a relatively common case of a WordPress blog served over HTTP/2:
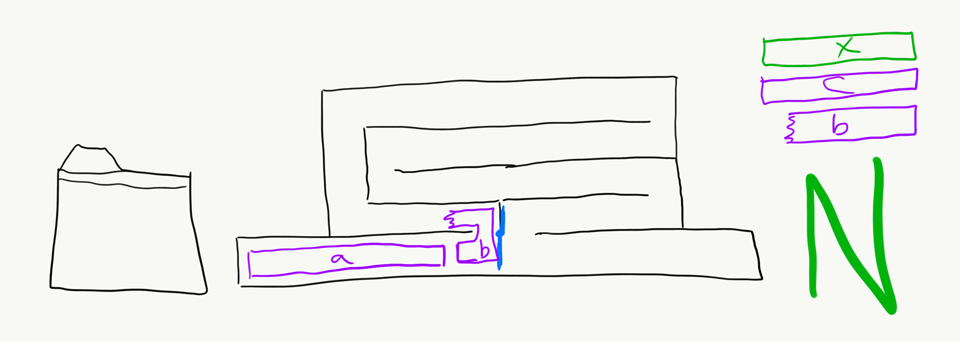
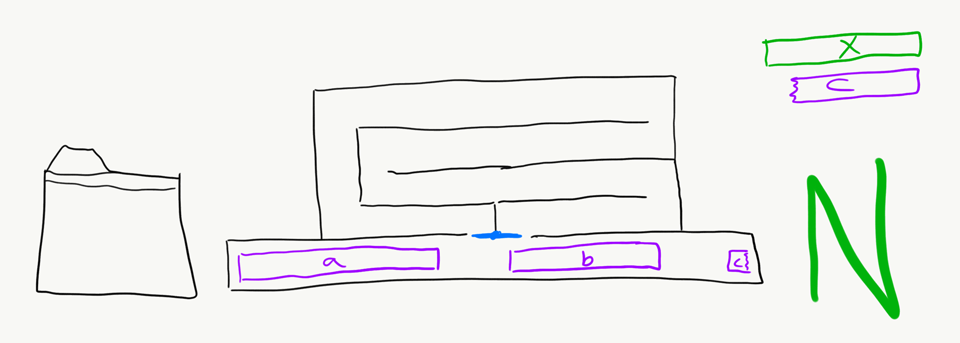
The page from the tuned server (After) starts to render at 1.8 seconds. The page from the tuned server (After) is completely done rendering at 4.5 seconds, well before the default configuration (Before) even started to render. Finally, at 10.2 seconds the default configuration started to render (8.4 seconds later or 5.6 times slower than the tuned server). Visually complete on the default configuration arrives at 10.7 seconds (6.2 seconds or 2.3 times slower than the tuned server).
Both configurations served the exact same content using the exact same servers with “After” being tuned for TCP_NOTSENT_LOWAT of 16KB (both configurations used BBR).
Identifying Prioritization Issues In The Wild
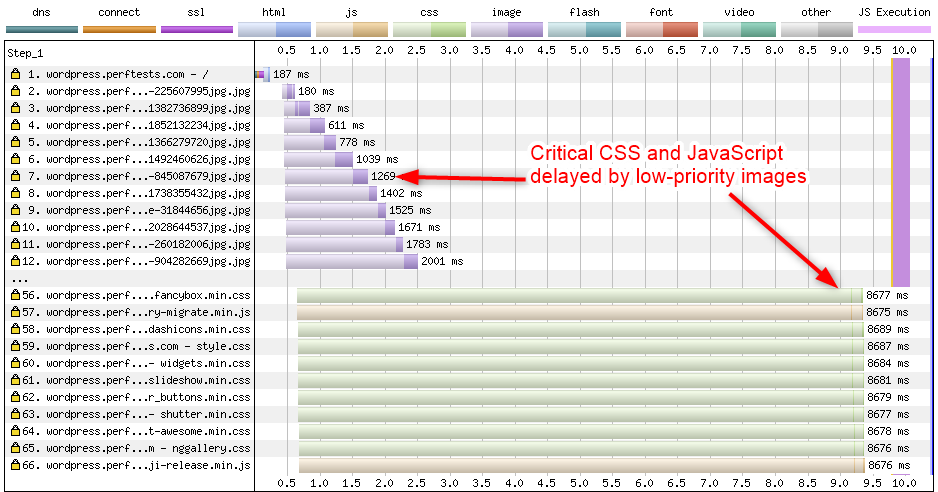
If you look at a network waterfall diagram of a page loading prioritization issues will show up as high-priority requests completing much later than lower-priority requests from the same origin. Usually that will also push metrics like First Paint and DOM Content Loaded (the vertical purple bar below) much later.
Network waterfall showing critical CSS and JavaScript delayed by images.
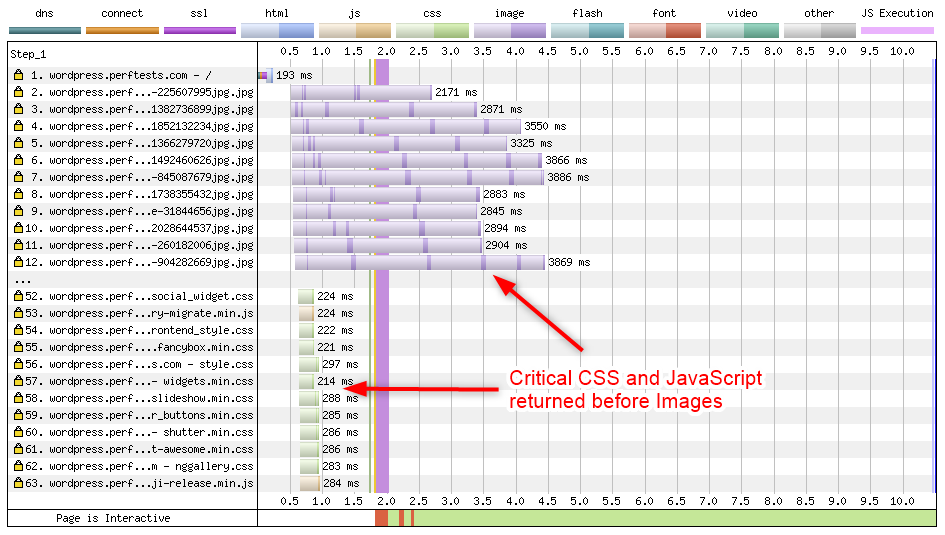
When prioritization is working correctly you will see critical resources all completing much earlier and not be blocked by the lower-priority requests. You may still see SOME low-priority data download before the higher-priority data starts downloading because there is still some buffering even under ideal conditions but it should be minimal.
Network waterfall showing critical CSS and JavaScript loading quickly.
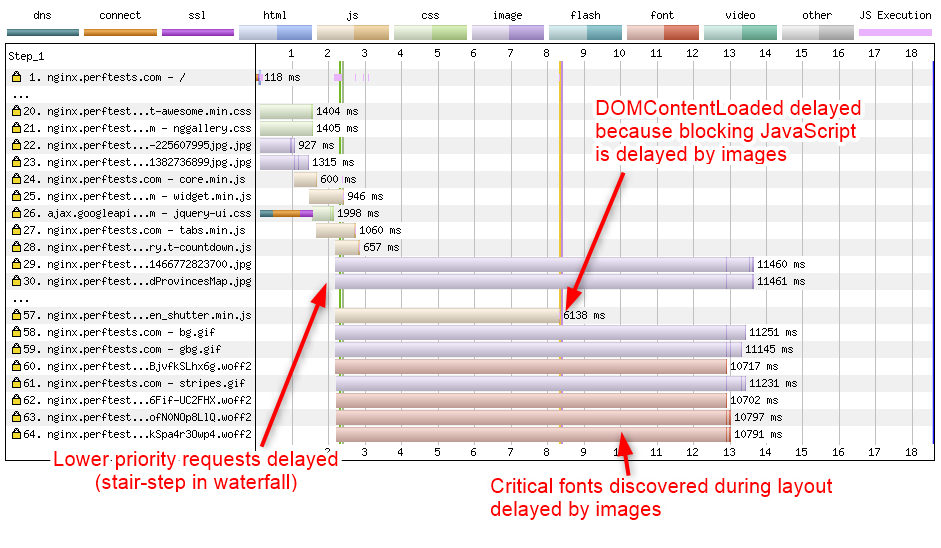
Chrome 69 and later may hide the problem a bit. Chrome holds back lower-priority requests even on HTTP/2 connections until after it has finished processing the head of the document. In a waterfall it will look like a delayed block of requests that all start at the same time after the critical requests have completed. That doesn’t mean that it isn’t a problem for Chrome, just that it isn’t as obvious. Even with the staggering of requests there are still high-priority requests outside of the head of the document that can be delayed by lower-priority requests. Most notable are any blocking scripts in the body of the page and any external fonts that were not preloaded.
Network waterfall showing Chrome delaying the requesting of low-priority resources.
Hopefully this post gives you the tools to be able to identify HTTP/2 prioritization issues when they happen, a deeper understanding of how HTTP/2 prioritization works and some tools to fix the issues when they appear.